|
|
Birmingham Civic Dashboard: E-Government to We-Government via Open Data6. October 2011 – 18:31 by John Heaven (TuTech Innovation GmbH) |
In its recent consultation document ‘Making Open Data Real’, the UK Government expresses high hopes for open data, heralding it as possibly “the most powerful lever of 21st century public policy”. Following several years of open data advocacy, activism and hack days, in the UK open data is moving towards the mainstream thanks to unanimous backing from the coalition government and the opposition.
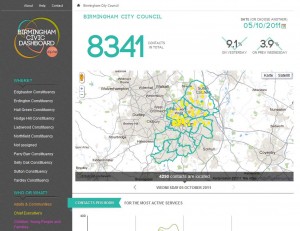
The latest move in open data comes from Birmingham City Council, which today launched its ‘Civic Dashboard’. This is a web site publishing raw customer services data along with a slick visualisation, which was made possible by a grant that Digital Birmingham received as a result of winning a competition run by the National Endowment for Science, Technology and the Arts (NESTA).
The Civic Dashboard draws its data from the customer service centre set up as part of the Council’s Business Transformation programme. An extract of data about all customer enquiries, whether by telephone, internet or email, is recorded by the customer relationship management system and fed into the Civic Dashboard in an aggregated (anonymised) form once per day. Where the data is geocoded, it can be presented on a map to show how many contacts originate from a particular ward or constituency. You can even see which channels the enquiries come through, which shows that the Council receives far more enquiries by telephone than through other channels.
This is an important step towards bridging the gap between eGovernment and ‘weGovernment’. Coming from the Council that was heavily criticised for spending £2.8m on its website as part of its eGovernment transformation, especially by Birmingham’s vocal social media users, opening up the data that is produced in the background shows what the new infrastructure can do beyond serving up static content. Doubtless there are many more datasets that exist as a result of the transformation programme, and if these are released in the future, perhaps Brummies will feel they got a better deal out of transformation than they first thought.
This itself is quite a paradox: such a handover of control to the citizen wouldn’t have happened if it weren’t for the huge transformation programme because IT is absolutely necessary for the collection of data in a reusable form.
Another important aspect is the fact that the raw data comes with a ready-made visualisation tool, which is presumably what most people will interact with. On the one hand, some would argue that it should be left to non-state entities to interpret the data. Although this will probably be the case in future, Birmingham (together with NESTA) engaged Mudlark, a local service provider, to develop the website on their behalf. This model – of commissioning the data visualisation, not developing it in-house – addresses the issue of risk sharing: especially in the early days of open data, small companies may not be able to afford to risk creating applications based on data that there may not be a market for, and that – for all they know – may not be collected for ever, at least in the current format.
Even where an authority doesn’t publish its own visualisation of the data, in my opinion there will still be a role for them to intervene in some cases. For instance, if someone were to notice that there are far more requests from Hodge Hill than Sutton Coldfield (a more affluent area), and claim that resources are unfairly distributed, a Council official might intervene using social media to draw attention to the fact that far more council housing tenants are located in that area, and are most likely making enquiries to the Council as their landlord. This assumes that the necessary data (on distribution of council housing) is available; if not, it could lead to calls for more data to be opened. Thus, opening some data can lead to calls for more.
There is much more to be said about this example of open data in practice, which is possibly the first time a large public authority has bridged the gap between between e-government and ‘we-government’ using open data. I’m sure it will be said on this blog and elsewhere for a good while to come!
Many thanks to Simon Whitehouse, of Digital Birmingham (part of Birmingham City Council), for explaining the Civic Dashboard to me.
Tags: Birmingham, birmingham city council, digital birmingham, inenglish, open data, UK


One Response to “Birmingham Civic Dashboard: E-Government to We-Government via Open Data”
By Simon Whitehouse on Oct 13, 2011
Hello John
Thank you for the write-up, it’s much appreciated.
One thing that I have become increasingly aware of during the development of the Civic Dashboard is that what we are doing is publishing data almost entirely out of context. Yes, you can see the change in demand for services over time, but not the context that you describe in your post about the relative number of council tenants in different areas.
Already we have had requests for more detail about the types of housing repairs that are requested and also for website statistics to compare against the number of phone calls we take.
I hope this means that the Civic Dashboard will act as a generator of demand for more open data to make sense of the (relatively) tiny bit we are releasing with through the site.